


I’ll be talking about trading Forex charts and using real-time charts to work with the Forex market today. Many traders, especially novices, may become discouraged when they see different Forex charts. Trading charts appear to be difficult for a novice trader to comprehend. But that’s just how it seems.
Instead of confusing regular traders, every form of Forex chart is meant to make trading easier. Price-based chart analysis becomes more accurate and effective when you use Forex charts since they make it simpler to examine large amounts of data. The ability to convert enormous amounts of information—typically numerical—into a different, less abstract form is crucial for traders who work with this kind of data.
What Are Forex Charts?
Graphical depictions of currency exchange rates over time are seen in forex charts. These charts offer a visual representation of the performance of a certain currency pair, enabling traders to examine past price changes, spot trends, and make wise trading choices.
One may configure the charts to display trading activity for a specific time frame, such as ten minutes, an hour, two hours, a day, a week, or two weeks. While longer time periods give a broader view of trends and market behavior, shorter time frames could reveal more specific insights concerning price variations. The most popular types of forex charts are often shown as line, bar, or candlestick charts. In the post, we will go further into these charts.
What are price quotes and Forex charts?
An introduction to trading currency pairs is provided via foreign exchange trading charts. A trader must be able to recognize patterns with accuracy beforehand. Understanding how Forex charts are made, the many kinds of charts that are available, the trading time frames, and how to arrange the visual representation of the price movement can help you spot investment chances.
There are two main methods used in contemporary trading to make future price projections. The first is fundamental analysis, which examines all the information around a financial asset, including exchange rates, the economic calendar, political news, and general market opinion. The second is technical analysis, which is the study of the price itself. Technical analysts just need to examine information about a financial instrument, its financial indices, rumors, news, and official statements if it is mostly evident from fundamental research.
However, when examining the price itself, everything is different. It is not necessary to watch the price in order to assess it. Specifically designed price charts were created to track a financial instrument’s price fluctuations.
We are well aware that the chart is a line that varies along two axes because of our education. Thus, this is exactly how the trading activity price chart appears. This line fluctuates on both the price and time axes (quotes).
Because computer technology had not yet advanced, traders were unable to track price fluctuations on a computer screen when the first charts were created. Investors create the initial price charts using graph paper for this reason. Most of the time, they were just dots that were joined by a line based on daily price fluctuations.
The changes in the provided data over time and in relation to one another are visually shown in a chart. Traders constructed the charts using the following data:
- OPEN: The instrument’s price at the start of a trading session is known as the “opening price,” or OPEN.
- CLOSE: closing price, is the instrument’s price at the conclusion of a trading session.
- HIGH: the highest price for a specific amount of time.
- LOW: the lowest cost for a specific amount of time.
- Volume: the total number of contracts signed within a specific time frame.
How to Interpret the Common Forex Chart Types
This list should provide you with a solid understanding of how to interpret primary forex charts if you are new to forex trading. You’ll discover that certain forex charts provide you with more insightful data than others. While some traders find great success using tick charts, others detest reading tick charts and prefer to use candlestick charts, which provide higher profits.
Even if your friends or coworkers could have suggestions, you should test each of these Forex charts until you determine which one you think functions the best. If a chart is no longer useful, you shouldn’t feel bound to it since it once functioned. It is not a prudent long-term investing plan to stick with just one type of investment.
Additionally, you may combine these Forex charts as you study to find the most effective indications.
1. Tick Charts
Tick charts, as the name implies, show a data point each time the market ticks or moves. Because a tick chart lacks a defined time axis, a short-term trader may concentrate solely on the price activity. Trends, resistance, and support are all clearly visible on tick charts. For example, in MetaTrader 4, you may double-click on the relevant currency pair in the MarketWatch box to view a tick chart.
The tick chart will then appear on the left, and a box will appear allowing you to input orders or trades on the right. The offer side of the market is represented by the red line on the tick chart, while the bid side is represented by the blue line.
2. Point-and-figure Charts
Professional forex traders frequently utilize point-and-figure Forex charts, which are among the most popular chart styles. They may now filter changes in the exchange rate, recognize levels of clear support and resistance, and even trade certain patterns thanks to this. Similar to the tick chart, this kind of chart enables a trader to concentrate just on the movement of the exchange rate because it lacks regular time intervals on the x-axis.
On graph paper, point-and-figure charts are commonly created by filling a rising column of boxes with an X and a falling column of boxes with an O. On the graph, each box denotes a certain value that the exchange rate must reach in order to be labeled as an X or an O.
A reversal parameter, which is often set at three boxes, is another feature of these charts. This indicates that in order to change the current column from using the X to using the O, or vice versa, at least three box moves are needed. A reversal causes the graph to move one column to the right as well.
3. Line Charts
A series of individual exchange rate measurements made for each time period are connected by a straight line in line charts. Closing prices are typically used in these charts, although they may also be produced using starting, low, or high prices. Line charts are useful for identifying broad trends and other large-scale patterns on charts because they provide a comparatively simpler view of exchange rate movements.
A line chart features an x-axis with set time intervals, in contrast to a tick chart. You may see short-term patterns that impact any asset with the use of a line chart. As an illustration, you may witness a sharp drop associated with a selloff, followed quickly by a stock recovery. Line charts are another useful tool for monitoring a stock’s performance over extended periods of time. For instance, it is easy to see that a stock fell for a year as a result of bad news before rising in response to good news.
4. Bar Charts
Bar charts display each time period’s high, low, open, and close, which combined make up a bar. A little horizontal dash is depicted at the open level projecting to the left, and a vertical line connects the high and the low. A dash to the left that is horizontal indicates the closing level. These bars provide far more information, even though they are not related to each other the way the data points in line and tick charts are. Bar charts feature set intervals on the x-axis, much like line Forex charts do.
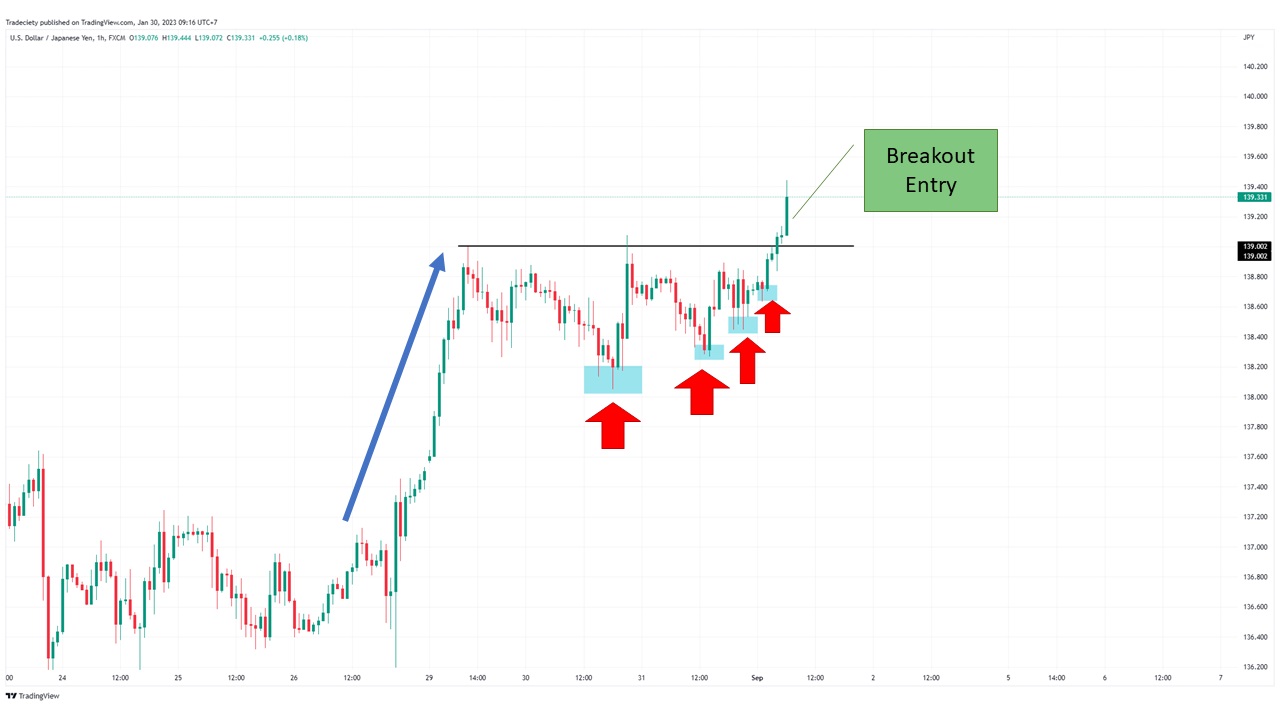
When there are exchange rate gaps—that is, when the range of one time period does not overlap the range of the succeeding period—bar charts come in handy. Additionally, they can be helpful in determining whether a market has closed above a critical level in a chart pattern that could indicate a breakout. Long-term trends may be seen in bar charts, but interpreting the spreads between each bar may be more challenging. You may create a line chart that gives you more information about the stock’s performance if you only monitor one price on a bar chart.
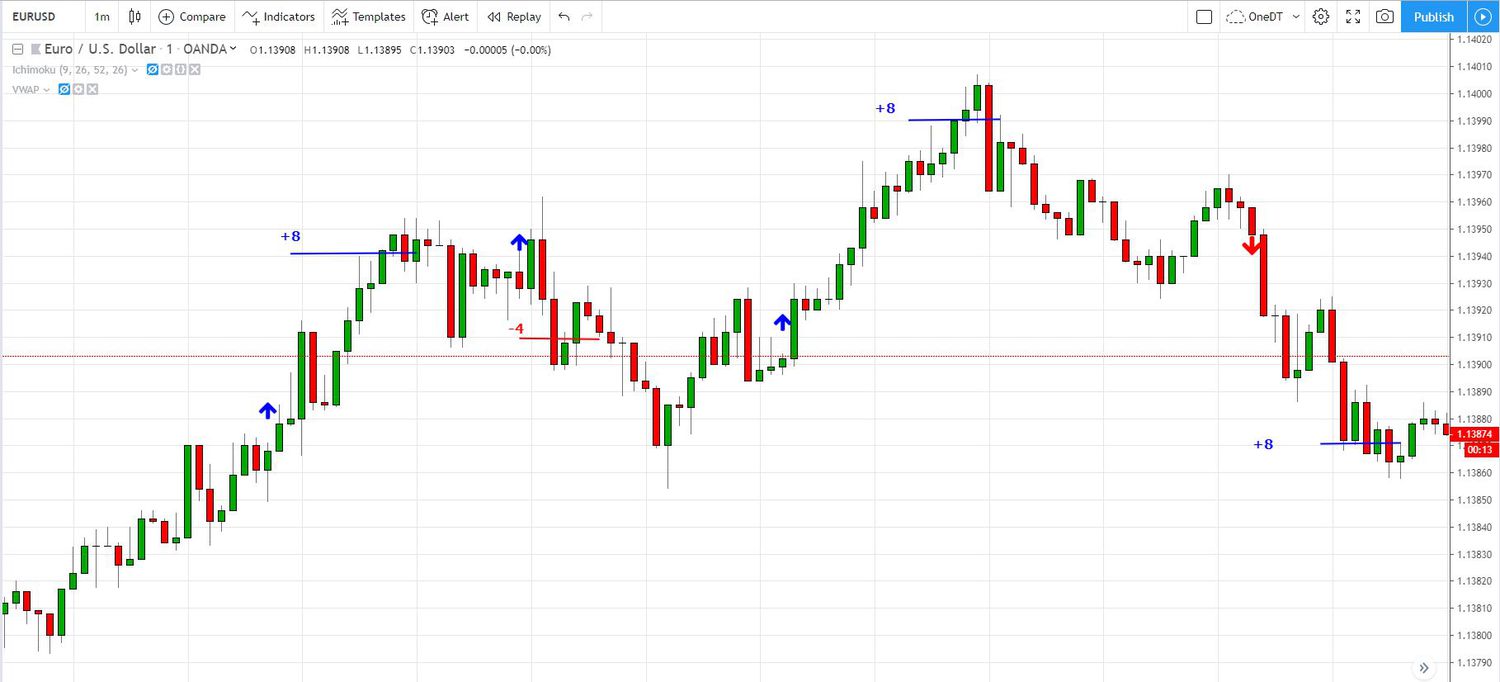
5. Candlestick Charts
A Japanese creation, candlestick charts provide much more information than a bar chart since the body color of the candle indicates whether the market was rising or falling during the given timeframe. For instance, a rising or bullish candle may be represented by a white body, while a falling or bearish candle might be represented by a black body.
Wicks are the vertical lines that connect the close and the high, as well as the low and the open. When it comes to forecasting future market behavior, the length of the wicks on certain candles is longer than on others. This difference can be rather important.
Actually, a whole school of technical analysis has developed around some candlestick combinations that are both predictive and legitimate chart patterns in and of themselves. Numerous of them go by colorful titles like shooting stars, doji, hammer, and hanging man.